By Dennis Busch, Terry Loeffelholz and Will Keast, Pioneer Farm Agroecosystems Research Program University of Wisconsin-Platteville
The mission of Pioneer Farm Agroecosystem Research is to support the local farming community by conducting systems and applied research investigating the impacts of agronomic practices on farm sustainability. Recently, we have been conducting on-farm research investigating the impacts of cover crops on water quality. More specifically, this research project was focused on evaluating how the use of cover crops impact surface-water runoff, soil loss, and nutrient loss from cropland acres at multiple positions and slopes within cropland acres. Our goal for this project was to quantify soil loss reductions from cover crops across the landscape to help farmers better prioritize where to establish cover crops when resources do not allow them to cover all acres.

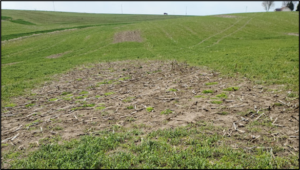
To evaluate how the use of cover crops impacts soil loss, rainfall simulations were conducted on cropland operated by Darlington Ridge Dairy and Stone Front Dairy in southwest Wisconsin. Cover crops were seeded in fields at Darlington Ridge Dairy (winter rye, 70 lbs./acre) and Stone Front Dairy (winter rye, 70 lbs./acre) in the fall of 2020. However, portions of the fields at multiple landscape positions were left unseeded to serve as comparisons for rainfall simulations (Photo 1). Each treatment was replicated four times. At Darlington Ridge Farms, corn was planted on April 29, 2021; cover crops were terminated on May 5, 2021; and rainfall simulations were conducted on May 27, 2021. At Stone Front Dairy, cover crops were terminated on April 19,2021, corn planted on May 5, 2021, and simulations conducted on June 4, 2021. Plots at the Darlington Ridge Farms were dominated by Ashdale silt loam soils, while soils at Stone Front Dairy included both Fayette and Palsgrove silt loam soil series.
Rainfall simulation plots were located on multiple positions on the landscape with slopes ranging from 1.5 to 12 percent to determine how slope influenced runoff and soil loss. At Darlington Ridge, rainfall simulations were conducted at the shoulder and backslope positions but not at the summit. In contrast, simulations were conducted at the summit as well as shoulder and backslope positions at Stone Front Dairy.
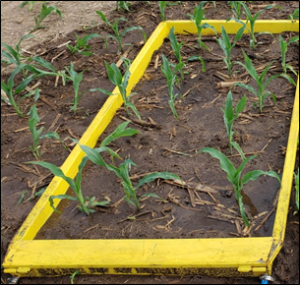
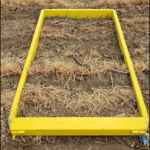
The rainfall simulator is designed to apply uniform rainfall at a rate of 2.8 inches per hour with rainfall droplets similar in size and energy to a typical rainfall event. Windscreens measuring 10 feet tall, 10 feet wide, and 10 feet long were used to isolate field plots (2 meters x 2 meters) from which runoff was collected. Field plots are isolated by pressing steel plot boundaries into the soil to a depth of 2 inches. Collection trays were connected to the downslope side of the plot boundaries to support collection of surface-water runoff from plots.
The duration of a simulated event is variable and is dependent on how long it takes for runoff to begin after starting the simulated rainfall. A simulated event is ended 30 minutes after runoff is first observed from the plot. Typical simulations will last 35 to 45 minutes. Simulated events were conducted on two consecutive days on each plot (day 1 simulation wets soils to field capacity, and data is collected from simulation conducted on day 2). All runoff from plots was collected, measured, and thoroughly mixed prior to collection of samples. Collected samples were submitted to laboratory and analyzed for total solids, nitrogen and phosphorus.
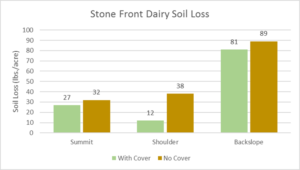
Rainfall simulations resulted in consistently higher soil loss from plots without cover crops. At Stone Front Dairy, the largest difference observed was on the shoulder slope where plots without cover produced 38 lbs. of total solids per acre compared to 12 lbs. of total solids lost from plots with cover crops. This difference was statistically significant (p= 0.10). Differences observed at the summit and backslope were not statistically significant.

There was no cover crop residue visible in the cover crop plots at Stone Front Dairy. The lack of cover crop residue at Stone Front Dairy is likely due to the longer time between cover crop termination and conduct of the rainfall simulation. This may partially explain why soil loss from cover crop plots was nearly as large as the soil loss from non-cover crop plots.

Greater differences in soil loss from cover crop and non-cover crop plots were observed at Darlington Ridge Farms. On the backslope, plots without cover crops lost an average of 301 lbs. of soil per acre compared to 24 lbs. of soil loss per acre from the plots with cover crops. However, this difference was not statistically significant due to treatment variability. On the shoulder landscape position, the difference in soil loss between cover and no-cover plots was statistically significant. Plots with no cover crop lost an average of 175 lbs. of soil per acre compared to only 3 lbs. of soil loss per acre from plots with cover crops. No simulations were conducted at the summit landscape position at Darlington Ridge Farms.
Cover crop residue was visible in the plots at Darlington Ridge Farms at the time rainfall simulations were conducted. The cover crop residue is likely the reason why soil loss from the cover crop plots is much lower than loss observed in plots with no cover crop.

Results of this study have shown that cover crops reduce soil loss, and the amount of soil loss reduction varies across the landscape. However, it also illustrates that the benefit of cover crops varies with time and may diminish quickly after termination. Data suggests that the longer termination of cover crops is delayed, the more protection the cover will provide from erosion. However, delayed termination of the cover crop also may result in reduced soil moisture which may reduce yield. More research is needed to quantify this trade-off to improve on-farm decision making.
